
TL;DR:
- Most businesses focus on revenue figures, but profitability analysis reveals which products and channels truly create value.
- It involves examining costs and margins at various levels, including product contribution margins, to guide strategic decisions and resource allocation.
Most business professionals know their revenue figures. Far fewer can tell you which products, clients, or channels are actually making them money. That gap is where profitability analysis lives. Understanding what is profitability analysis means moving beyond top-line numbers to examine where genuine value is being created and where it is being quietly eroded. This guide walks you through the core concepts, frameworks, and practical steps you need to turn raw financial data into decisions that sharpen performance, protect margins, and position your business for lasting growth.
Table of Contents
- Key takeaways
- Core profitability metrics and types
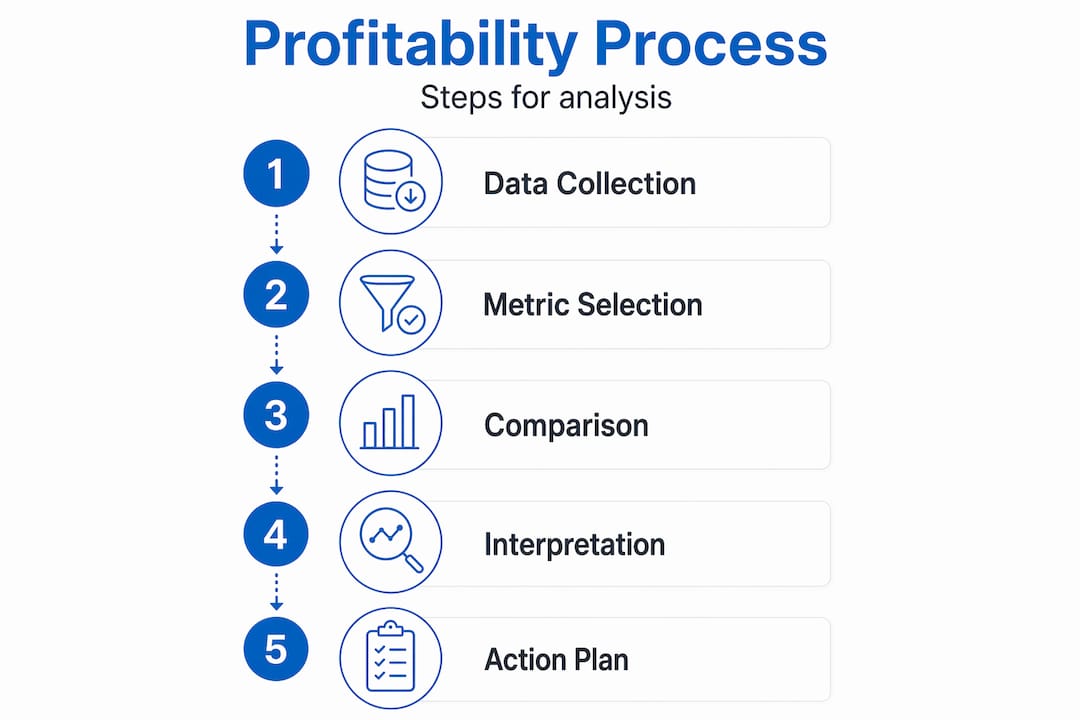
- How to conduct profitability analysis
- Benchmarking and interpreting your results
- Strategic impact of profitability analysis
- My honest take on what most businesses get wrong
- Ready to turn your analysis into action?
- FAQ
Key takeaways
| Point | Details |
|---|---|
| Profitability analysis goes beyond revenue | It reveals which products, services, or segments truly generate value after costs are accounted for. |
| Use layered contribution margins | CM I and CM II frameworks separate variable and fixed cost impacts for sharper product decisions. |
| Benchmarking is non-negotiable | A 10% net margin means something different in retail than in professional services; context is everything. |
| Free cash flow signals true health | Earnings can flatter; free cash flow reflects the actual cash your business is generating. |
| Avoid arbitrary cost allocation | Shared overheads distort product-level results; use attributable cost logic for accurate decisions. |
Core profitability metrics and types
Profitability analysis is the systematic process of examining your financial results to understand what is driving profit, what is consuming it, and where the greatest opportunities for improvement lie. It is not a single calculation. It is a discipline. And when applied well, it transforms the way you allocate resources and make strategic decisions.
The most widely used profitability metrics each tell a different part of the story:
- Gross profit margin measures how much revenue remains after direct production costs. It reflects the efficiency of your core operations.
- Operating profit margin deducts operating expenses from gross profit, revealing how well the business manages overheads before financing costs.
- Net profit margin is the bottom line. Every pound of cost, tax, and interest has been removed, showing what the business actually keeps.
- Return on Equity (ROE) expresses profit relative to shareholder equity. It is useful for investors but requires care in interpretation.
Beyond these company-level metrics, product-level profitability analysis adds another layer of clarity. Product profitability analysis distinguishes between variable margin (CM I) and contribution after attributable fixed costs (CM II), revealing which products truly create value. A product with a positive CM I looks profitable at first glance. But once you account for the fixed resources it consumes at the CM II level, the picture can change entirely.
Ratio analysis adds further context by comparing metrics against historical performance or industry peers. No metric is meaningful in isolation. A 20% gross margin might signal strength in one sector and serious trouble in another.

How to conduct profitability analysis
The profitability case framework is built on one deceptively simple equation: Profit equals Revenue minus Cost. The power lies in how deeply you dissect both sides of that equation. Here is a practical approach you can follow.
-
Gather your financial data. Pull your income statement, management accounts, and any product or segment reporting you have. The more granular, the better.
-
Calculate your key margins. Work through gross, operating, and net margins. Flag any trends over the past 12 to 24 months. A 5% revenue rise alongside an 8% profit decline implies a 13% rise in costs relative to revenue. That pattern is worth catching early.
-
Break revenue into its drivers. Separate changes in price, volume, and product mix. If revenue has grown, you need to know whether that growth came from higher prices, more units, or a shift in the mix of what you are selling.
-
Analyse your cost structure. Distinguish between fixed costs (those that remain regardless of output) and variable costs (those that move with volume). This separation is critical for understanding contribution margins and for modelling the impact of growth decisions.
-
Apply the CM I and CM II framework. Calculate contribution margin at the variable cost level (CM I) and then subtract attributable fixed costs specific to that product or service (CM II). This gives you a far more honest picture of product-level profitability.
-
Identify root causes, not just symptoms. If margins are declining, drill into whether the issue sits in pricing, cost creep, volume shortfall, or product mix shift.
| Framework level | What it measures | Typical use |
|---|---|---|
| Gross margin | Revenue minus direct costs | Core operational efficiency |
| CM I (variable margin) | Revenue minus variable costs | Product contribution at marginal level |
| CM II (attributable margin) | CM I minus attributable fixed costs | True product profitability |
| Net margin | Profit after all costs and tax | Overall business health |
Pro Tip: Avoid allocating shared overheads to product lines using arbitrary methods such as revenue percentage. Attributable cost logic only assigns costs that would disappear if the product were discontinued. This keeps your product-level decisions grounded in reality rather than accounting convention.
Benchmarking and interpreting your results
Numbers without context are just numbers. A profitability assessment only becomes meaningful when you measure it against a relevant reference point. That means comparing your margins against industry norms, historical performance, and your own strategic targets.
Consider grocery retail. Gross profit margins in grocery retail often range between 20% and 30%, making even small improvements to margin significantly impactful. In that environment, a 1% improvement in gross margin across millions of transactions is a material win. In professional services, gross margins above 50% are more typical. The operating margins of professional services agencies are shaped by staff utilisation, pricing power, and project mix.
Financiers typically view overall business profitability of 5% to 10% as sufficient, with higher percentages indicating stronger financial health. That is a useful baseline for SMEs when assessing whether their business is viable, but it is a floor rather than a target.
One metric that deserves more attention than it typically gets is free cash flow. Free cash flow is more reliable than earnings for assessing long-term profitability because it reflects actual cash available rather than accrual accounting. Earnings can be smoothed. Cash cannot be faked.
Be equally cautious with ROE. A very high ROE can indicate excessive leverage rather than genuine operational efficiency. When you see an unusually strong ratio, your first question should be whether it reflects real performance or simply a highly leveraged balance sheet.
The discipline of benchmarking your profitability results against industry peers and standards is what separates reactive financial management from genuinely strategic thinking.
Strategic impact of profitability analysis
When you understand where profit is actually being created in your business, decisions that once felt difficult become straightforward. Profitability analysis gives you the clarity to act with confidence rather than instinct.
Here is where that clarity directly influences strategy:
- Portfolio rationalisation. Product or service lines with negative CM II values are consuming resources without returning value. Profitability analysis is a strategic capability that drives decisions about product mix and resource allocation. Rationalising your portfolio frees capital and management attention for lines that genuinely perform.
- Pricing decisions. When you can see the contribution margin at the individual product level, pricing conversations change. You stop guessing what discount you can afford and start negotiating from a position of knowledge.
- Cost control. Identifying which cost categories are growing faster than revenue allows you to act before the impact becomes critical. The factors affecting profitability in SMBs often include hidden cost creep in areas like logistics, labour rates, or supplier terms.
- Investment prioritisation. When capital is finite, directing it towards the highest-margin segments first is not just sensible. It is the discipline that separates businesses that scale from those that stagnate.
Pro Tip: Focus on the critical few profitability metrics that align with your strategic goals rather than tracking every possible ratio. Net margin aligned to your growth objectives and CM II at the product level will tell you more than a dashboard of 20 loosely connected figures.
Profitability analysis also reveals patterns that are invisible at the aggregate level. A business might show healthy overall margins while masking a handful of loss-making products propped up by high-performers. That structural weakness only becomes visible when you look at the SMB profitability checklist and dig below the surface numbers.
My honest take on what most businesses get wrong
In my experience, the most common mistake I see is not a failure to analyse profitability. It is a failure to analyse it at the right level. Business owners and analysts often focus on the company P&L and stop there. Revenue is up, margins look acceptable, so the assumption is that things are fine.
What I have learned is that fine at the aggregate level often conceals serious problems underneath. I have worked with businesses where three product lines were subsidising seven underperformers. When we ran the CM II analysis, the owners were genuinely shocked. They had been working harder to grow revenue from products that were actively destroying value.
The other trap I see regularly is over-reliance on earnings figures without checking free cash flow. Earnings can be engineered through accounting choices. Cash tells the unvarnished truth about whether your business model actually works.
My contrarian view is this: profit margin analysis is not a finance function. It is a leadership function. The most successful business owners I know treat their profitability metrics the way a good coach treats a performance review. Honest, specific, and used to drive real change rather than manage appearances.
If you want to optimise profitability for sustainable growth, start by asking harder questions about where the money is actually going.
— Shane
Ready to turn your analysis into action?
Understanding profitability analysis is the first step. Turning that understanding into a structured improvement plan is where most businesses need support.

At Summitscale, we work with business owners and leadership teams to move from financial confusion to genuine clarity. Our coaching helps you identify the metrics that matter most for your specific business model, build the discipline to track them consistently, and make the strategic decisions that protect and grow your margins. Whether you are looking to rationalise your product portfolio, tighten cost control, or build a business that funds the life you want, the right support makes the difference. Explore how business coaching drives profitability or learn why coaching is worth the investment for your next stage of growth. Schedule your free 15-minute assessment call today.
FAQ
What is profitability analysis in simple terms?
Profitability analysis is the process of examining your revenue, costs, and margins to understand where your business is generating real financial value and where it is losing it.
Which profitability metrics matter most?
Gross margin, operating margin, net margin, and free cash flow are the most telling. At the product level, CM I and CM II provide the sharpest picture of where value is genuinely created.
How often should you conduct a profitability assessment?
A full profitability assessment should be completed at least quarterly, with monthly monitoring of key margin metrics to catch deterioration before it becomes a structural problem.
Why can high ROE be a warning sign?
A very high ROE can indicate excessive leverage rather than operational strength. Always benchmark ROE against industry peers and check the underlying balance sheet before drawing conclusions.
What is the most common mistake in profit margin analysis?
The most common mistake is analysing profitability only at the company level. Arbitrary overhead allocation at the product level distorts results. Use attributable cost logic to make product decisions you can trust.

